AgriKA-GIS
In developmentA spatial-temporal framework for rice productivity mapping and yield forecasting in Laguna, Philippines, combining remote-sensing data with machine learning.
- Python
- Flask
- PostgreSQL
- GIS
- Sentinel-2
- Machine Learning
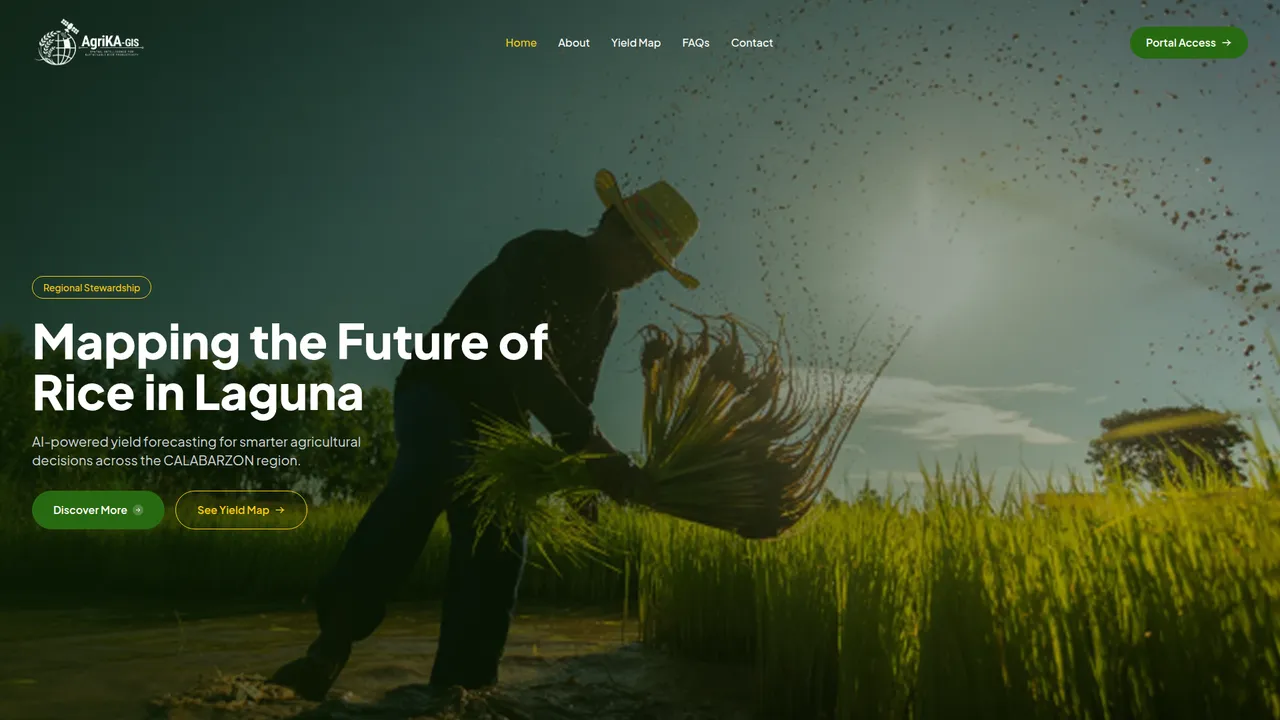
AgriKA-GIS is a spatial-temporal framework for rice productivity mapping and yield forecasting in Laguna, Philippines. It brings together satellite remote-sensing data, a spatial database, and machine-learning models to turn raw imagery into forecasts that are actually useful to the people planning around them.
What it does
AgriKA-GIS maps and forecasts rice yield down to the barangay and municipality level, then shows it on an interactive web map. The current build is centered on Laguna as its pilot region, with Cabuyao and Santa Rosa as focus areas. From the app, you can:
- Explore yield on a map: a color-coded view of rice productivity across Laguna’s municipalities and barangays, drawn from real boundary data.
- See forecasts, not just history: each area carries a model-predicted yield backed by its satellite and weather record over time.
- Work behind a login: accounts gate the dashboard, so it runs like a real tool rather than an open demo.
How it works
The project is really two halves that meet in a spatial database: a data and modeling pipeline, and a web-GIS that serves the results.
- Data collection: satellite imagery is pulled from Copernicus (Sentinel-2) and weather from Open-Meteo, gathered monthly per barangay and municipality.
- Feature building: those sources are aligned with historical yield into training rows, in both flat and time-sequence form, so the models have a clean spatial-temporal history to learn from.
- Modeling: a CNN-LSTM model pairs spatial pattern recognition with temporal sequence learning to forecast yield. It’s checked against a baseline model and validated with out-of-fold predictions and paired significance testing, so the gains are measured rather than assumed.
- Storage and serving: boundaries (GeoJSON for the province, municipalities, and barangays) and results live in a PostgreSQL/PostGIS database served by a Flask API, with a JavaScript web-GIS frontend rendering the maps. Data can be pushed to Supabase for hosting.
What I learned
The biggest lesson was about data. When you’re predicting anything or training a model, the quality and the amount of data matter more than almost anything else. Good, reliable data, and a lot of it, is what lets the model actually learn the real patterns instead of noise.
The other half was people. Talking to the LGUs, staying on the same page with them, and walking them through the system turned out to be essential. And honestly, that’s the thread across all of my projects: communicating with the person on the other end is what really matters.